Introduction
At the time of independence in 1962, Kigali looked like a small village with approximately 6,000 inhabitants and an area of 3 km2. It experienced significant urban growth between 1962 and 1984. At that time, the population reached 150,000 inhabitants, and the city occupied an area of 12 km2. However, after the genocide against the Tutsis, especially after the 2000s, that this urban growth accelerated at a rate of 6 % per year (Chauliac and Delaveau, 2015). By 2013, the population had reached 1.3 million. Currently, the area occupied by the city of Kigali is now 730 km2 and is home to nearly half of Rwanda's population. Projections call for 4.2 million inhabitants by 2040 (National Institute of Statistics, 2021).
In addition to spatial expansion, the city of Kigali has undergone significant physiognomic transformations. The first master plan was put in place in 2007. At that time, the developments concerned only the Nyarugenge district, the oldest settlement area in the city (World Bank Group, 1987). Other areas of the city were marked by anarchic developments. Harre et al. (2015) characterized Rwanda's pre-2010 cities as small linear settlements lacking an original centre. Sirven (1987) referred to the under-urbanization of Rwanda's cities, describing Kigali as a small town where urbanization was not a priority and the housing situation was not good. Starting in 2010, the urban development master plan was rolled out across the city (Rwanda Housing Authority, 2016). This master plan was updated in 2019 and shows an expansion of infrastructure towards the south and east of the city. Several important infrastructure projects, in terms of roads and administrative and cultural buildings, have been initiated, including the "Kigali Convention Center" (inaugurated in 2016) or the Kicukiro road to Bugesera airport, which remains under construction.
Today (2022), Kigali has become a modern city structured around several poles. These consist of a city centre that contains administrative and business buildings located in the district of Nyarugenge in the west, dense residential neighbourhoods in the district of Kicukiro in the east, loose residential neighbourhoods in the district of Gasabo in the northeast and dense popular neighbourhoods interspersed throughout each district. However, one of the effects of this rapid growth of the city is the artificialization of land at the expense of green spaces. Moreover, in the context of climate change and rising temperatures, the extension of artificial surfaces is likely to increase the surfaces that absorb solar radiation and amplify urban heat islands during hot periods.
At the scale of Rwanda, apart from the work of Mugiraneza and Hafner (2022), there are almost no studies regarding the impact of land artificialization on the increase in surface temperatures. However, the issue of increasing urban surface temperatures has become an important environmental and health issue (InVS, 2019). Several studies have shown the repeated effects of urban heat islands on the excess mortality of urban populations due to increasingly frequent heat waves combined with increasingly high urban densities (Besancenot, 2003, InVS, 2019). The objective of this study is to conduct a geo-historical analysis of the urban expansion of the city of Kigali and its consequences on the evolution of surface temperatures. On the other hand, we identified the neighbourhoods most affected by heat islands.
Data and methods
To map the evolution of the urban area, we used Landsat images from 1984, 2010 and 2021. These dates correspond to the different growth periods of the city of Kigali with reference to the studies of Chauliac P. and Delaveau J. (2015) and the National Institute of Statistics (2021). A land use classification was first performed on each of the three images, and then we subsequently extracted the built-up areas. The characterization of urban dynamics from image processing is complemented by field observations and comparison of old and current photographs. Land surface temperatures are derived from Landsat imagery archived on the Climate Engine platform and available for the period 1980 to 2022. The highlighting of the effect of urban dynamics on the development and extension of urban heat islands between 1984 and 2021 is based on the monitoring of the trajectories of urban areas and the surface temperatures of the ground.
Results
The results concern, on the one hand, the evolution of the urban surface between 1984 and 2021 and, on the other hand, the analysis of the air temperatures and highlight the warmest surfaces of the city. Finally, the results relate urban extension to the spatiotemporal variability in surface temperatures by considering the covariation of their trajectories.
Land Artificialization
Kigali is considered a green city. Indeed, more than three-quarters of the city's area is occupied by wooded areas, agricultural areas, marshes and cultivated wetlands (Manirakiza and Vincent, 2015, Rwanyiziri et al., 2020). However, it is also a territory characterized by rapid densification of its built-up area. Mugiraneza et al. (2022) showed that this densification consisted of the construction of new buildings and paved roads to replace vegetated areas in the old built-up areas, particularly the city centre; the conversion of peri-urban cultivated land into buildable areas for the extension of the central urban areas; and the development of new residential areas away from the old built-up areas.
The two following photos (photos 1 and 2) allow us to understand the important physiognomic transformations that occurred in Kigali. In the first photo, dating from the 1970s, the city of Kigali looks more like a tiny town. There are only a few buildings, and most of the houses in the foreground are small. The city is organized by a few main routes delimiting unstructured neighbourhoods. The photo also shows that no street is paved or tarmacked.
The second photo shows the same area in 2022 with the well-structured residential area of Kicukiro in the foreground and the administrative buildings of the city centre and the emblematic convention centre in the background, symbolizing the modernization of the city of Kigali.
Photo 1
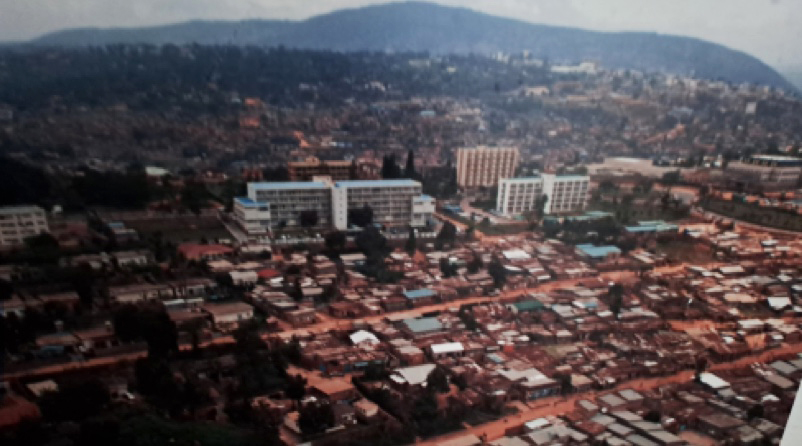
A view of the city of Kigali at the foot of Mount Kigali during the 1970s. In the foreground, one can see a poorly developed neighbourhood consisting of small houses and unpaved streets with larger buildings in the background
(Kigali City Hall archive)
Photo 2
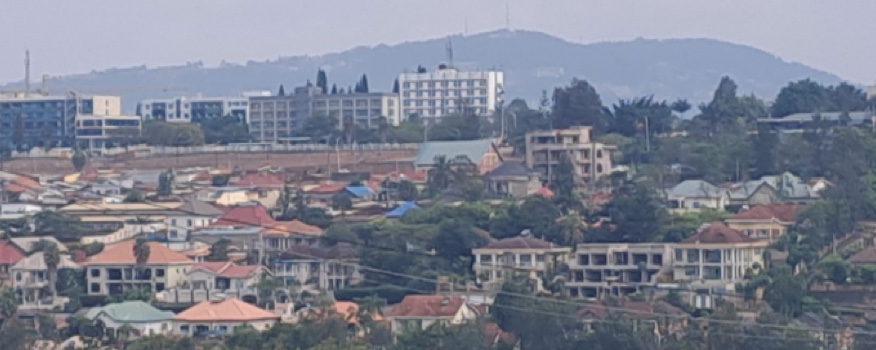
A view of the city of Kigali at the foot of Mount Kigali taken in August 2022. In the foreground, we can observe a modern and structured building district. In the background, one can observe, in addition to the buildings existing before 2010, a series of new buildings
(Brou, 2021)
Different types of urbanization can be identified in the city of Kigali. According to the 2019 master plan, there are very dense, medium-dense and low-density residential areas. The region is also categorized by informal settlements and activity zones, namely, commercial, administrative, tourist and industrial districts.
The photo 3 shows an example of informal settlements. This type of habitat is characterized by the absence of structure and by houses built primarily with rare and valuable materials. The national strategy for the improvement of informal residential areas direct the implementation of nationwide rules for the development of these types of areas, which have developed without complying with urban planning guidelines.
Photo 3
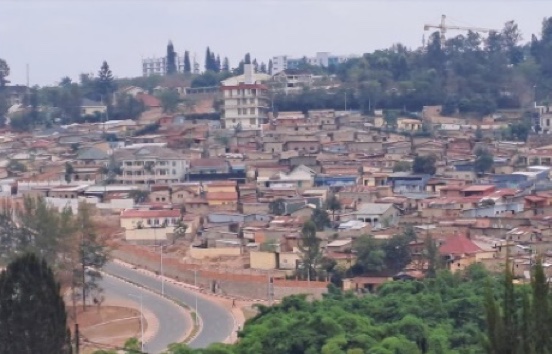
A view of the informal settlement of Kibiraro. This spontaneous, densely populated neighbourhood is fringed by the forest in the background. The absence of modern urban infrastructure and its location on the hillside makes it vulnerable to erosion and landslides
(Brou, 2021)
Photo 4

A view of the distinct Convention Centre and Radisson Hotel in the upscale Kimirura district. Their construction is part of the general pattern of modernization and beautification of the city. Here, the developments integrate green spaces
(Brou, 2021)
Photo 5
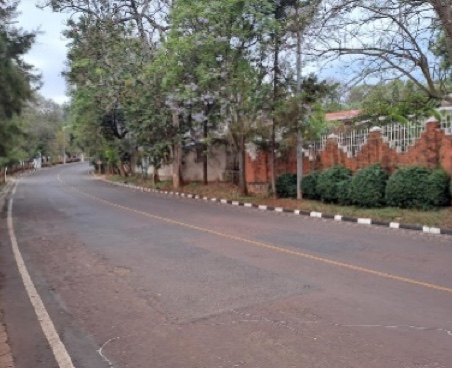
A view of the residential area of Kiuvu, which is considered the headquarters of President Kagame's residence and those of several ambassadors, as well as the location of the chic hotels. Here, the streets are wide and wooded
(Brou, 2021)
Photos 4 and 5 show examples of modern neighbourhoods and residential areas. In this type of neighbourhood, houses and urban infrastructure are developed in a sustainable way with the creation of green spaces and gardens. Compliance with these zoning regulations is manifested by the introduction of passive and active recreation areas, including neighbourhood parks, car-free zones and other public recreation areas that are already being created in the city of Kigali. The creation of green spaces consisting of parks, areas reserved for sports and ecotourism activities, forest areas, and agricultural areas as outlined in the master plan should promote the quality of life in each urban neighbourhood (City of Kigali, 2019).
Figure 1 shows the long-term evolution of the urban area from 1984 to 2021. Indeed, until 1984, the city was mainly limited to the central-western areas. However, between 1984 and 2010, the urban area was reinforced and strongly progressed towards the north and the east towards the airport. Recent developments are the most remarkable. In 2021, the urban area reached the eastern and southern limits of the city of Kigali while also progressing to the northeast.
Figure 1 Spatial evolution of the urban area from 1984 to 2021 in Kigali
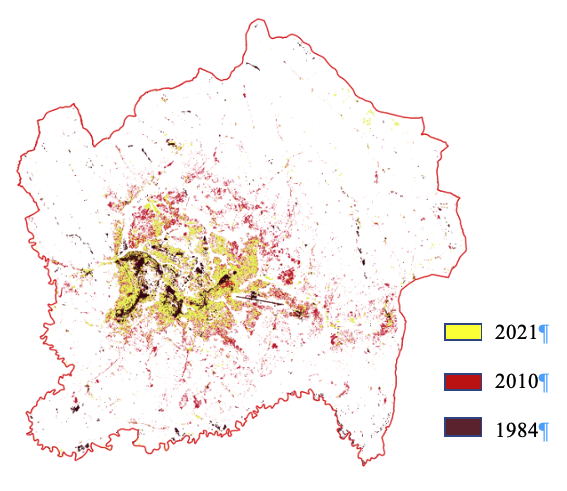
Source: Landsat Images
Credit, Author (data processing and map production): Télesphore Brou, 2023
Several studies have already highlighted the rapid evolution of developed areas at the expense of forest areas and other types of vegetation in Kigali. For example, Mugiraneza et al. 2020 showed that between 1987 and 2019, developed areas increased by 66 %, while forests and lowland vegetation decreased by 4 % and 24 %, respectively.
In conjunction with this expansion of urban landscapes at the expense of vegetation, we observe variability in thermal conditions.
Spatiotemporal evolution of hot surfaces in Kigali in relation to vegetation density between 1984 and 2021
The following maps (Figure 2) allow us to analyse the spatial distribution of the urban heat island of Kigali city. Until 1984, the hottest surfaces were located in the city centre since the rest of the city was only moderately developed. In 2009, the urban heat island effect strengthened within the city centre, but it mainly extended to the east. The current situation shows a continuous pattern of hot surfaces from the centre to the eastern and southern borders of the city while the temperatures of the downtown area increase. The vegetation index maps, which show the decline in vegetated areas in favour of bare soil, follow the same trajectory as the surface temperatures between 1984 and 2021 (Figure 2).
Figure 2: Spatial and temporal variability of hot surfaces and the normalized difference vegetation index (NDVI) in the city of Kigali from 1984 to 2021
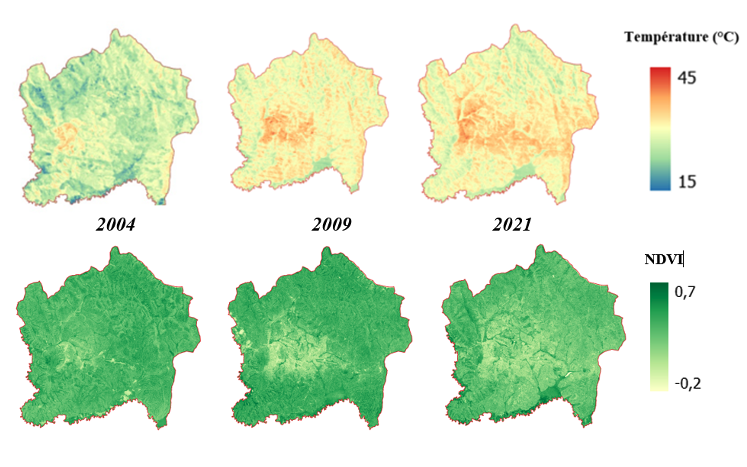
Source: MODIS Images
Credit, Author (data processing and map production): Télesphore Brou, 2023
Analysis by neighbourhood (Figure 3) reveals that, in general, the location of the hot surface areas range from the centre/east to the south‒west, and alternate between warmer and cooler areas. However, the hottest surfaces are located in the Nyarugenge district, the administrative and business centre of the city. The Remera district in the city centre, a former residential and business district, is one of the hottest districts in Kigali. The hottest areas also extend to the centre/east in the Nyarugenge district and to the southeast in the Masaka district, which are the new development zones of the city of Kigali.
Figure 3: Identification of heat islands by neighbourhood

Source: Landsat Images
Credit, Author (data processing and map production): Télesphore Brou, 2023
The density of the built environment, the total area of the ground covered by asphalt or paving stones, and the virtual absence of vegetation explain these hot surfaces. Indeed, on these totally artificial surfaces, solar radiation is mainly absorbed and stored, thus contributing to the overheating at the surface. Photos 6 and 7 below show an aspect of the Nyarugenge and Remera neighbourhoods, which are among the hottest areas in the city. These areas have the common characteristic of being heavily covered by high buildings without gardens and by asphalt or paved streets that lack trees.
Photo 6
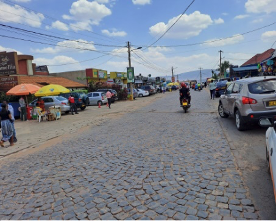
A view of the activity centre of the Remera neighbourhood in August 2022. The streets of this neighbourhood are entirely paved or asphalted. The buildings are on high ground. There are practically no trees
(Brou, 2021)
Photo 7
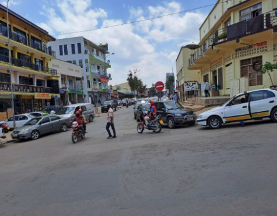
A view of the downtown commercial area in Nyarugenge in August 2022. The streets in this area are completely paved and the buildings are high. There is an almost complete absence of trees
(Brou, 2021)
Conclusion
This work has enabled us to highlight the rapid evolution of the urban surfaces of Kigali. From its status as a small, poorly developed city until urbanization increased in the 1990s, Kigali has undergone a major physiognomic and spatial transformation, particularly since the 2010s, which has made it one of the densest modern cities in Africa. This urban dynamism has naturally been accompanied by a sharp decline in vegetation cover and an increase in artificially covered areas. The analysis of surface temperature maps showed that the spatiotemporal evolution of hot surfaces follows the same trajectory as the expansion of the urban surface, extending from the historical centre to the eastern and southern limits of the city.
Even if Kigali is still considered a green city, thanks to the presence of many green spaces and some relic forested areas, some districts, notably the city centre and Remera, which are very developed, are almost devoid of vegetation and appear as heat islands.
Even if the impact that heat islands have on human populations are difficult to measure in Africa due to the lack of data, the identification and monitoring of these hot surfaces can be a tool for planning and public health. This can be done specifically through the creation of cool islands and by increasing the awareness of exposed populations. Critical steps towards achieving these goals involve increasing the number and frequency field-based temperature measurements and implementing a warning systems that would benefit the residents of Kigali. In addition, in areas that are not yet urbanized, developments should follow a pattern that differs from that of the already established residential areas. This can be achieved through the adoption of the integrated land use planning system that allows for the allocation of land to different uses, including the preservation and creation of green spaces. This planning system can help to control the density of the developed area and minimize the total surface area covered with asphalt or pavement.